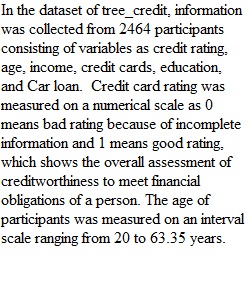
Q For this assignment, you'll be building your familiarity with data structure and SPSS. Watch these three videos: “Types of Data: Nominal, Ordinal, Interval/Ratio - Statistics Help” from Dr. Nic’s Maths and Stats (Dec. 13, 2011) Types of Data: Nominal, Ordinal, Interval/Ratio - Statistics Help (Links to an external site.) “01 How to Use SPSS - An Introduction to SPSS for Beginners” from Research by Design (Nov 30, 2017) 01 How to Use SPSS - An Introduction to SPSS for Beginners (Links to an external site.) “02 Descriptive Statistics and Frequencies in SPSS – SPSS for Beginners“ from Research by Design (Dec 5, 2017) 02 Descriptive Statistics and Frequencies in SPSS – SPSS for Beginners (Links to an external site.) Go to IBM SPSS Statistics on the Highline College Virtual Computer Lab Create a MS Word .docx file that you can save your work into and submit it on Canvas (it may be useful to connect a OneDrive account on the virtual machine so that it saves your work to the cloud). On the opening splash window, select the option for sample files and open the credit scoring data file “tree_credit.sav” Using the assigned "tree_credit.sav" data set, complete the following – number your answers as indicated (3 pts each) 1. What are the variables and what are their measures? What do the measures tell you about each of these variables? 2. Use the frequencies command to create a table for the ordinal variable. Copy and paste it into your document. What is the variable and what is the most frequently observed value? 3. Use the frequencies command to create a histogram for the scale variable(s). Be sure to uncheck the box for the frequency table. Copy and paste the histogram into your document. What does the histogram tell you about this data? 4. Use the frequencies command to calculate the minimum, maximum, mean, and standard deviation for the age variable. Copy and paste the results into your document. What do the minimum and maximum tell you for this specific variable? 5. Use the compare means command to calculate the mean ages (dependent variable) for the different credit rating groups (independent variable). Copy and paste the table into your document. What do the results indicate about any differences between the credit rating groups? Instructions for Accessing IBM SPSS Statistics 1. Access https://horizon.highline.eduLinks to an external site. Select HTML access, or download the Horizon client app 2. Login with your Highline username (like for Canvas) 3. Select Win10_Lab 4. It will log you on to a Windows 10 desktop - Once logged on, browse the appsanywhere menu for IBM, SPSS will be in that menu (or in search bar type SPSS) 5. Select the option for IBM SPSS Statistics 25
View Related Questions